ELK实践分享
ELK简介
ELK是三个开源项目的首字母缩写:Elasticsearch,Logstash和Kibana。Elasticsearch是一个搜索和分析引擎。Logstash是一个服务器端数据处理管道,它同时从多个源中提取数据,对其进行转换,然后将其发送到像Elasticsearch这样的存储。Kibana允许用户使用Elasticsearch中的图表和图形来可视化数据。
实践说明
- 服务器使用两台4核8GB阿里云主机
- 10.2.1.200 Filebeat、Logstash、Elasticsearch、Kibana
- 10.2.1.201 Kafka
- 所有应用部署使用ansible-playbook方式实现
软件版本
- filebeat-7.3.1-1.x86_64
- kafka_2.11-2.1.1
- elasticsearch-7.3.1-1.x86_64
- logstash-7.3.1-1.noarch
- kibana-7.3.1-1.x86_64
实践架构
- Filebeat–>Kafka–>Logstash–>Elasticsearch–>Kibana(使用X-Pack保障集群安全)
Elasticsearch部署
安装JDK及设置环境变量
1 | # rpm -ivh jdk-8u161-linux-x64.rpm |
Elasticsearch安装
1 | # rpm -ivh elasticsearch-7.3.1-x86_64.rpm |
配置TLS和身份验证
第一件事是生成证书,通过这些证书便能允许节点安全地通行。我们这里使用elasticsearch-certutil命令。
- 步骤1:Elasticsearch master node配置TLS
1
2
3
4
5
6
7
8
9
# /usr/share/elasticsearch/bin/elasticsearch-certutil --help
# /usr/share/elasticsearch/bin/elasticsearch-certutil cert -out config/elastic-certificates.p12 -pass ""
# cd /etc/elasticsearch && cp /usr/share/elasticsearch/config/elastic-certificates.p12 .
# vim /etc/elasticsearch/elasticsearch.yml
xpack.security.enabled: true
xpack.security.transport.ssl.enabled: true
xpack.security.transport.ssl.verification_mode: certificate
xpack.security.transport.ssl.keystore.path: elastic-certificates.p12
xpack.security.transport.ssl.truststore.path: elastic-certificates.p12
修改配置文件后,便可以重启主节点
- 步骤2:Elasticsearch集群密码
主节点重启后,便可以为集群设置密码了。 使用命令/usr/share/elasticsearch/bin/elasticsearch-setup-passwords auto生成随机密码或使用/usr/share/elasticsearch/bin/elasticsearch-setup-passwords interactive命令手动定义密码。记录这些密码。
Kibana部署
1 | # rpm -ivh kibana-7.3.1-x86_64.rpm |
kafka部署(单节点)
1 | # tar -zxf kafka_2.11-2.1.1.tgz /usr/local/ |
filebeat部署
1 | # rpm -ivh filebeat-7.3.1-x86_64.rpm |
Logstash部署
1 | # rpm -ivh logstash-7.3.1.rpm |
验证中间环节工作正常
filebeat到kafka通信验证
1 | # /usr/local/kafka/bin/kafka-topics.sh --list --zookeeper localhost:2181 确保存在topic名为logs |
kafka到logstash
1 | # /usr/local/kafka/bin/kafka-run-class.sh kafka.tools.GetOffsetShell --broker-list 10.2.1.200:9092 --topic logs --time -1 |
端到端验证日志
1 | 在安装filebeat的主机上执行三次生成三条日志 |
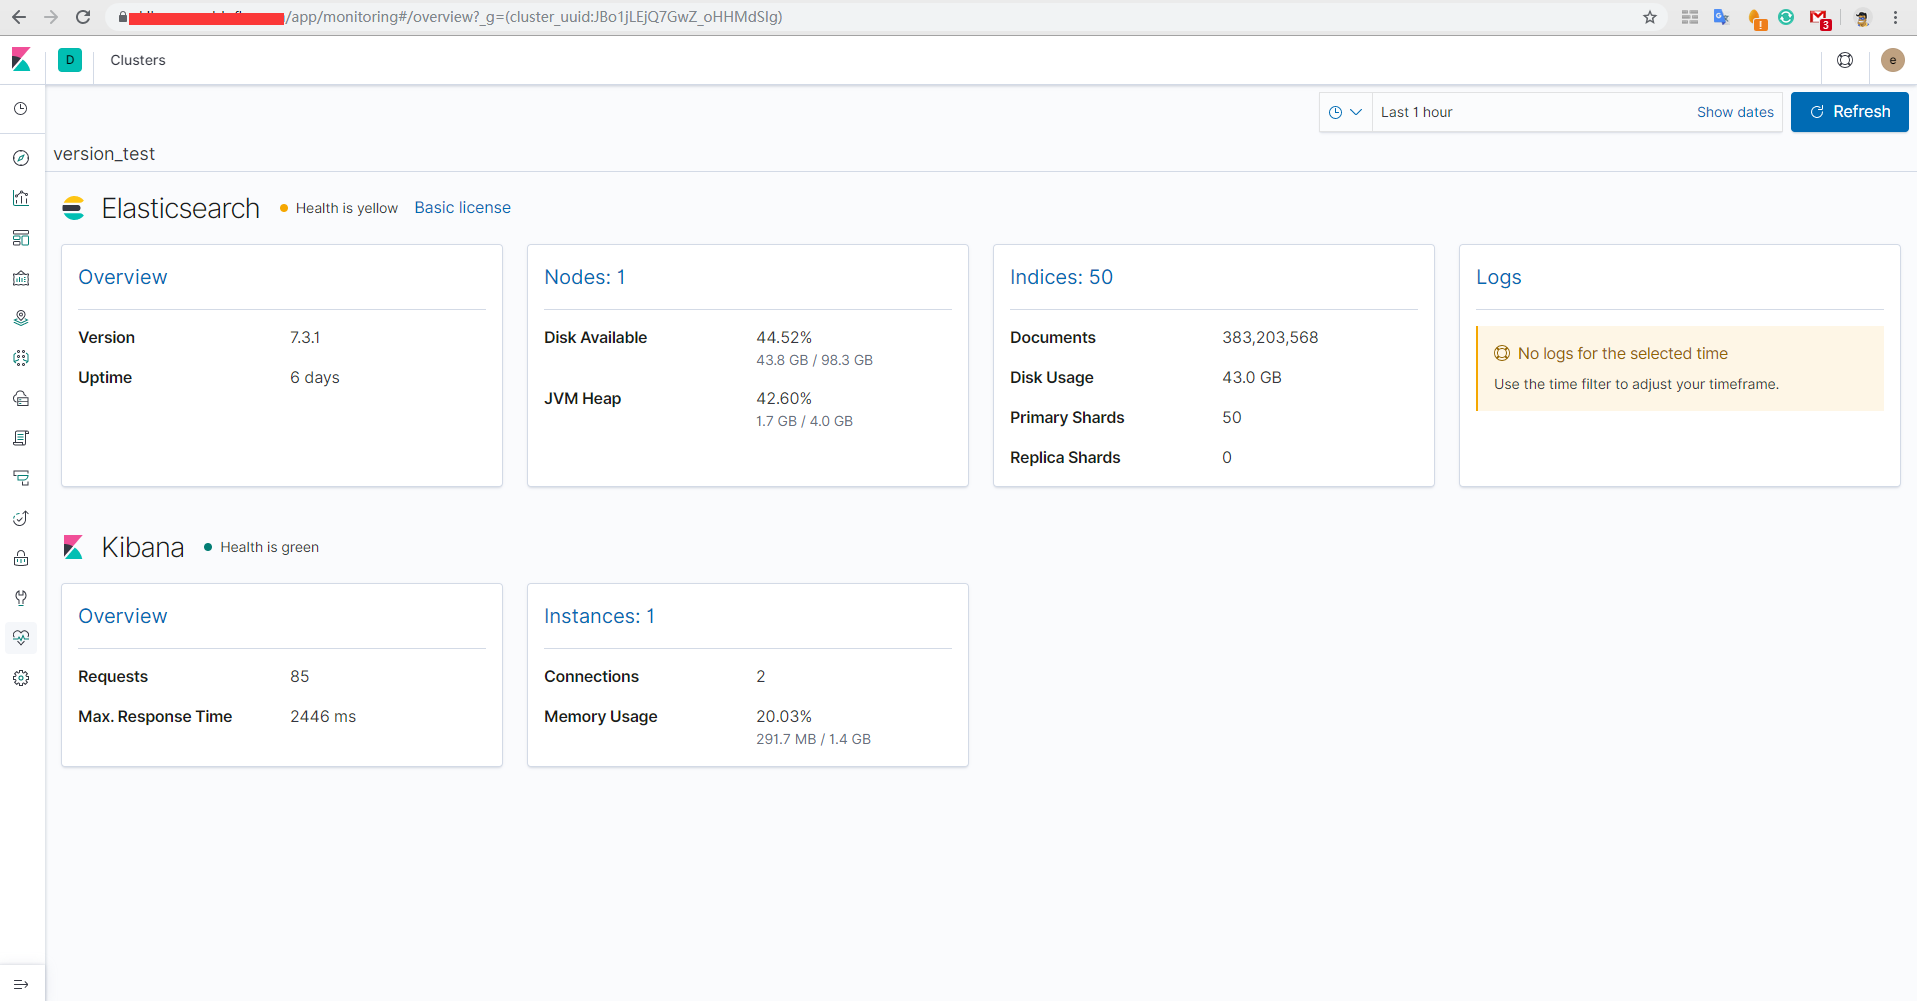
kibana验证日志数据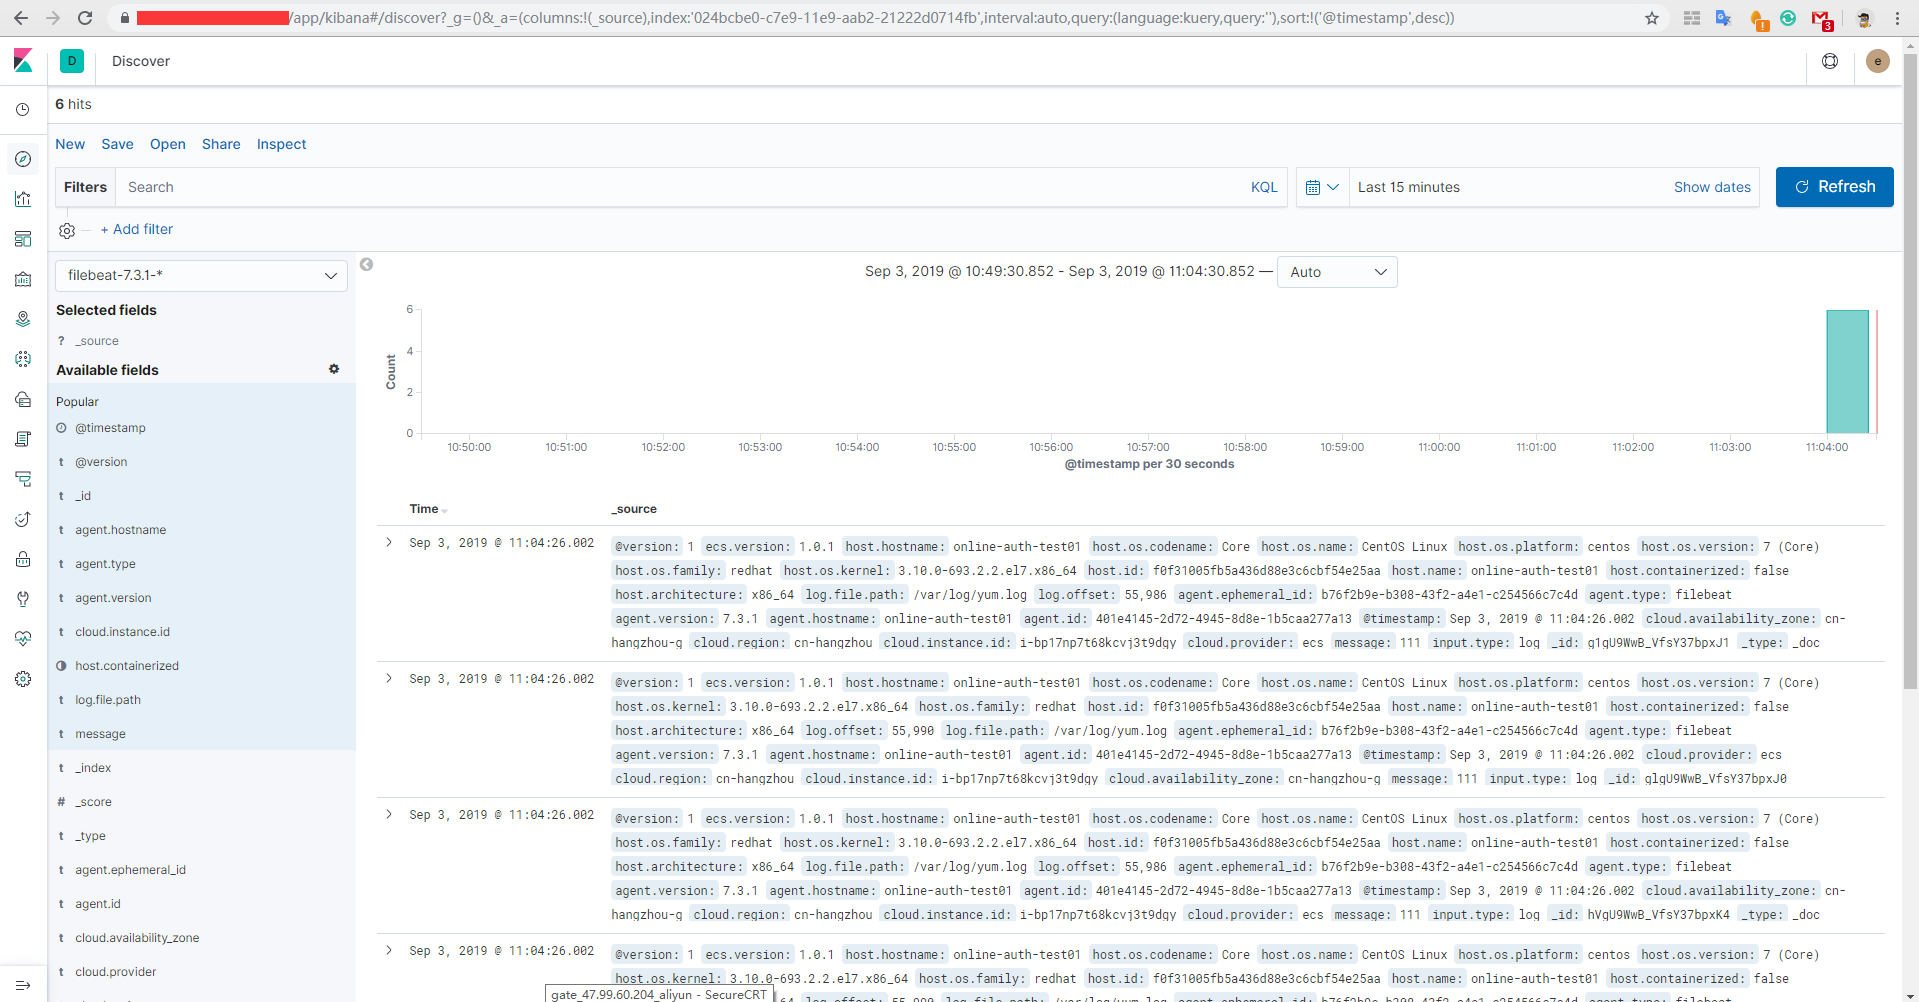
关于X-Pack几点说明
- 在7.x版本中X-Pack已经内置,无需单独安装
- 启用X-Pack后需要掌握Kibana中配置基于角色的访问控制(RBAC)
- 启用X-Pack后使用API的方法
1
2
# curl -u elastic:xxx "http://10.2.1.201:9200/_cluster/health?pretty" # 无交互调用API
# curl -X GET -u elastic '10.2.1.201:9200/_xpack/security/role' # 交互式调用API
小结
- Elasticsearch权限解决方案
- 1、X-Pack
- 2、SearchGuard插件
ELK暂时介绍到这里,有任何问题,可以留言。
======================================================
希望各位朋友支持一下
- 领取我的阿里云幸运券,谢谢.
- 使用腾讯云资源
- Linode VPS
- 搬瓦工VPS
- 阿里云1888元云产品通用代金券点我
- 阿里云最新活动全民云计算升级-拼团上云更优惠
本文作者:dongsheng
本文地址: https://mds1455975151.github.io/archives/628093c8.html
版权声明:转载请注明出处!